GEODEMO_6
Extracting a layer of velocity from a C-GRID model like ROMS
Contents
url = 'http://geoport.whoi.edu/thredds/dodsC/examples/bora_feb.nc';
hname = 'h';
uname = 'u';
vname = 'v';
aname = 'angle';
Use NCTOOLBOX for data access
Create a geodataset object that represents the dataset from the opendap endpoint
nc = ncgeodataset(url);

% Create variable objects that represent the variables of interest in the dataset
uvar = nc.geovariable(uname);
vvar = nc.geovariable(vname);
hvar = nc.geovariable(hname);
avar = nc.geovariable(aname);
Interpolate ROMS u and v vectors on to same grid as hvar (a rho variable)
Use the uvar and vvar objects and the avar (angle) variable object to interpolate velocity vectors onto rho grid points and rotate them according to the angle variable
Uobj = hvar.getvectors(uvar, vvar, avar);
Grab the data at the indices of interest
itime = 3; % 3rd time step
klev = -1; % last (top) layer
% Grab coordinate information at our indices
g = Uobj.grid(itime, klev, :, :);
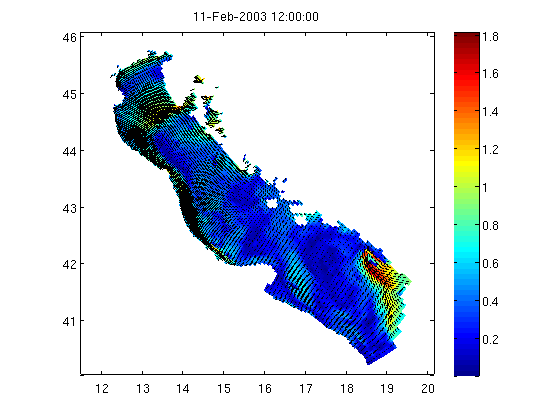
Plot vectors
Get the magnitude of the new vectors at our indices and plot, overlay with the vector representation of the new velocities
figure;
pcolorjw(g.lon, g.lat, Uobj.magnitude(itime, klev, :, :));
colorbar;
arrows(g.lon(1:end,1:end), g.lat(1:end,1:end),...
    Uobj.vectors(itime, klev, 1:end,1:end), 0.08, 'black');
title(datestr(g.time));
dasp(44);
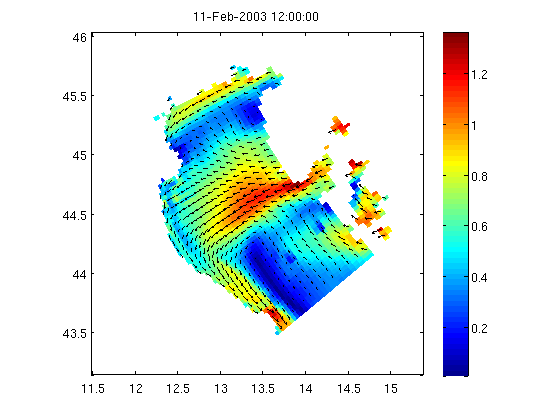
Plot subset of vectors
figure;
pcolorjw(g.lon(1:58, 1:70), g.lat(1:58, 1:70), ...
    Uobj.magnitude(itime, klev, 1:58, 1:70));
colorbar;
arrows(g.lon(1:2:58,1:2:70), g.lat(1:2:58,1:2:70),...
    Uobj.vectors(itime, klev, 1:2:58,1:2:70), 0.08, 'black');
title(datestr(g.time));
dasp(44);