GEODEMO_3
Using ZSLICEG to create a horizontal section from a 3D field
Contents
OpenDAP dataset:
uri = 'http://geoport.whoi.edu/thredds/dodsC/examples/bora_feb.nc'
uri =

http://geoport.whoi.edu/thredds/dodsC/examples/bora_feb.nc
Use nj_tbx legacy functions in NCTOOLBOX
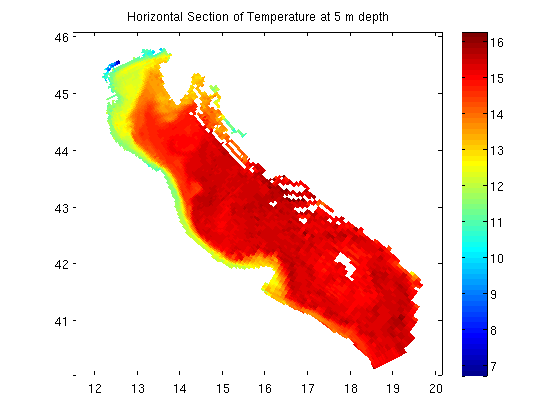
Get the 3d field at the first time step and intepolate the horizontal field to the constant 5m depth
[t,g]=nj_tslice(uri,'temp',1);% grab 3d field of 'temp' at time step 1
tz = zsliceg(t,g.z,-5);  % return temperature slice at 5 m depth
Plot the interpolated horizontal field
Plot the interpolated field with its coordinate axes, add a plot title and colorbar
figure
pcolorjw(g.lon,g.lat,double(tz));  % plot temp at 5 m depth
title('Horizontal Section of Temperature at 5 m depth');
colorbar