DEMO9A - Like demo9 but uses 'grid' and 'data' sytax to access a variable
and it's coordinate axis data in 2 seperate steps instead of the single call to 'struct' used in demo9a. You may want to do this if you need to subset base on the coordinates of a variable before pulling across a HUGE amount of data.
Contents
Demonstration of subsetting a CF convention dataset
echo('on')
url='http://geoport.whoi.edu/thredds/dodsC/coawst_2_2/fmrc/coawst_2_2_best.ncd';
ds = cfdataset(url);
url='http://geoport.whoi.edu/thredds/dodsC/coawst_2_2/fmrc/coawst_2_2_best.ncd';
ds = cfdataset(url);

%% Grab the variable of interest. No data is being read yet.
sz = ds.size('temp');
Grab the variable of interest. No data is being read yet.
sz = ds.size('temp');

% !! In demo9 we used 'ds.struct' to get the data and it's coordinate axes.
% In this demo we split that call into 'ds.grid' and 'ds.data' to fetch
% the coordinate axes seperate from the data.
% !! In demo9 we used 'ds.struct' to get the data and it's coordinate axes.
% In this demo we split that call into 'ds.grid' and 'ds.data' to fetch
% the coordinate axes seperate from the data.
%% Grab a subset of the coordinate data only (i.e. the coordinate 'grid')
% Data is now being pulled across the network
t = ds.grid('temp', [sz(1) sz(2) 1 1], [sz(1) sz(2) sz(3) sz(4)]);
Grab a subset of the coordinate data only (i.e. the coordinate 'grid')
Data is now being pulled across the network
t = ds.grid('temp', [sz(1) sz(2) 1 1], [sz(1) sz(2) sz(3) sz(4)]);
%% Grab the actual temp data
d = ds.data('temp', [sz(1) sz(2) 1 1], [sz(1) sz(2) sz(3) sz(4)]);
Grab the actual temp data
d = ds.data('temp', [sz(1) sz(2) 1 1], [sz(1) sz(2) sz(3) sz(4)]);
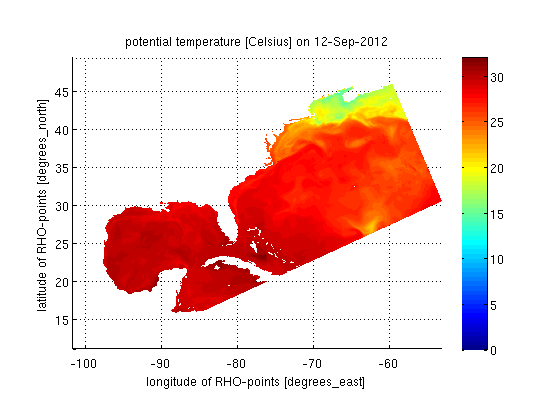
%% Make a pretty plot.
% Note the call to 'squeeze'. This removes singleton dimensions.
figure;
Make a pretty plot.
Note the call to 'squeeze'. This removes singleton dimensions.
figure;
surf(t.lon_rho, t.lat_rho, double(squeeze(d)))
shading('interp');
view(2)
axis('equal')

xatt = ds.attributes('lon_rho');
xname = value4key(xatt, 'long_name');
xunits = value4key(xatt, 'units');
xlabel([xname ' [' xunits ']'],'interpreter','none');

yatt = ds.attributes('lat_rho');
yname = value4key(yatt, 'long_name');
yunits = value4key(yatt, 'units');
ylabel([yname ' [' yunits ']'],'interpreter','none');

zatt = ds.attributes('temp');
zname = value4key(zatt, 'long_name');
zunits = value4key(zatt, 'units');
ztime = ds.time('time1', t.time1);
title([zname ' [' zunits '] on ' datestr(ztime)],'interpreter','none');

colorbar
shg
echo('off')